The New Trend Display In WebIQ 2.13
WebIQ 2.13 introduced a completely new Trend Display widget which is not based on the previous widget and brings with it a lot of new features.
Widget: Trend
The Trend widget is the core of the new trend widget collection and displays the trend based on data recorded in a recorder. It shows lines and curves for the trend items selected for display.
For each of the curves you can define the colors and whether the area below the curve should be filled with a color. In addition you can have multiple scales on either side and you can also group specific curves into a single scale as you can see on the left hand side. You can also fully localize the labels and date display on the x-axis.

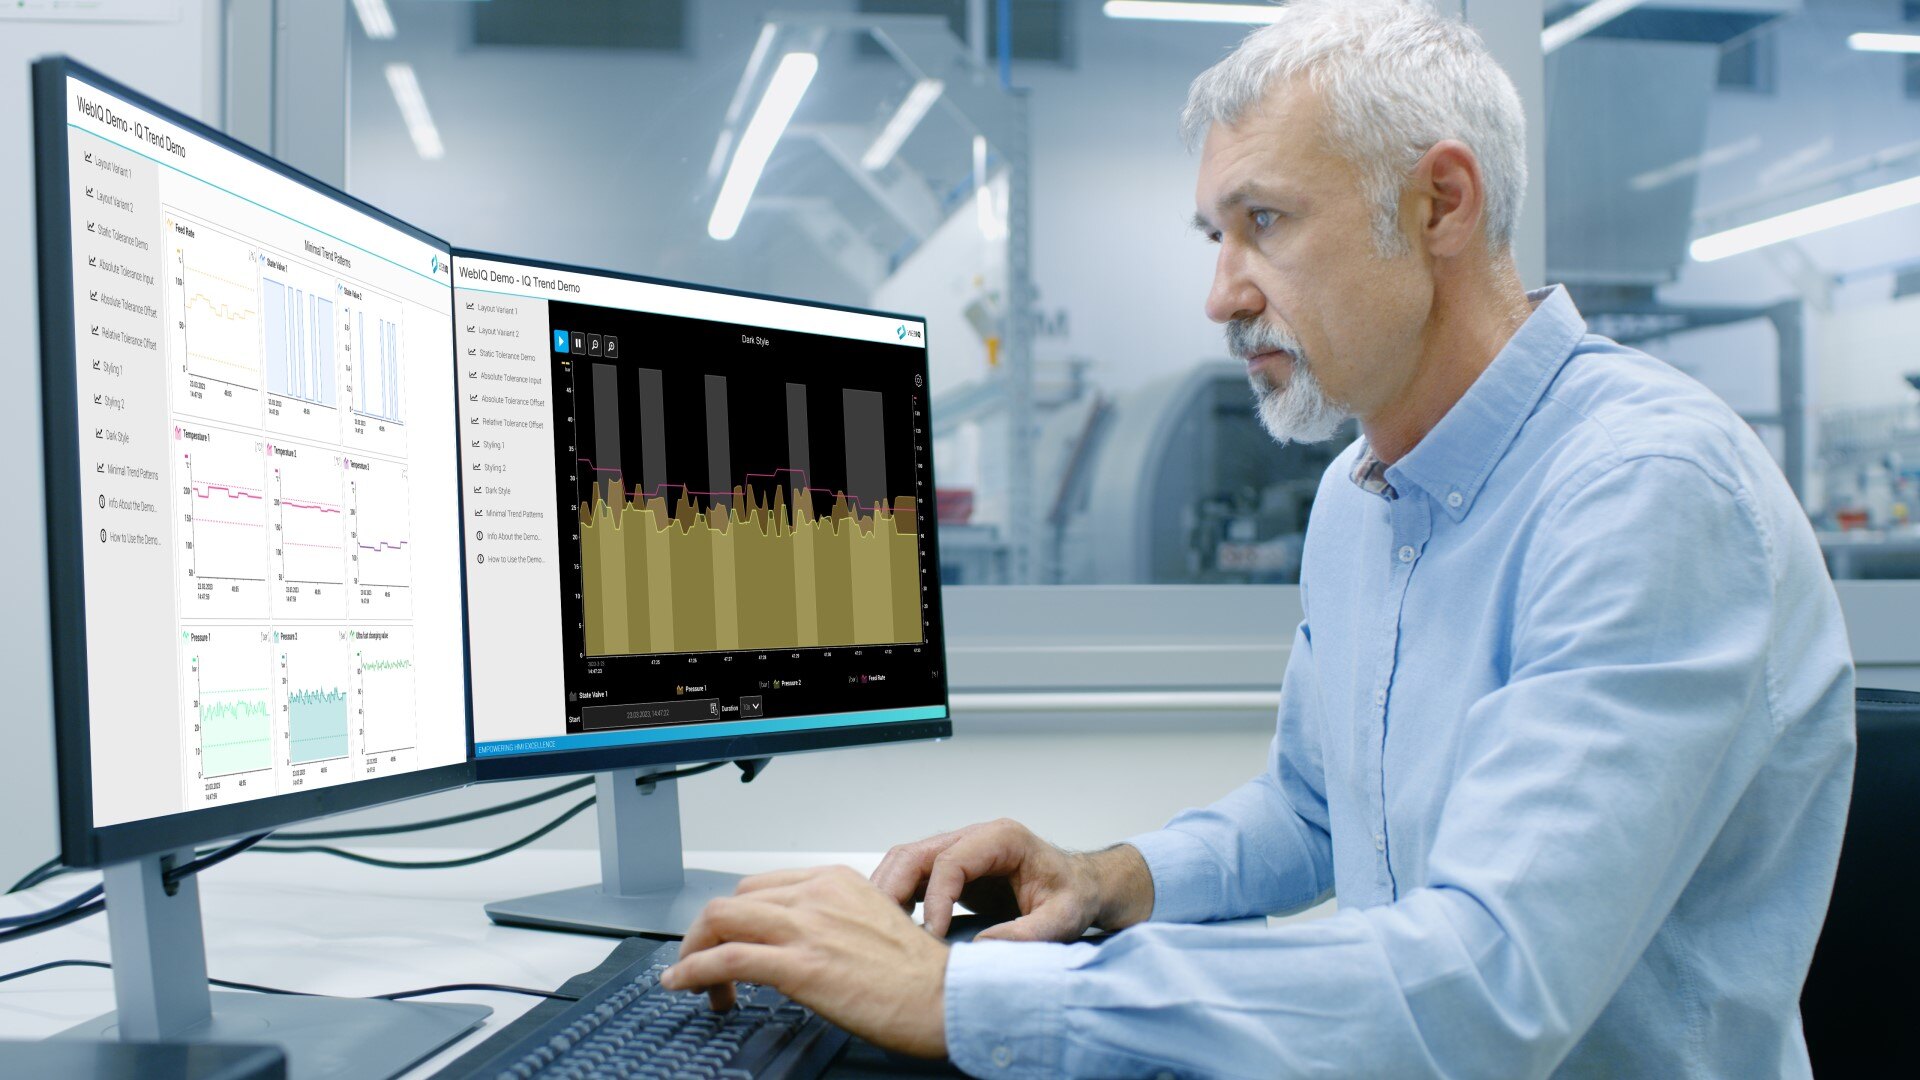
You can also style the widgets for example for a dark display:

To display the exact values at a specific date and time you can enable up to two handles that you can move around which display the recorded item values at that time. These can also be used to display an active recipe name for example.

Of course, tolerances for specific items can also be shown as well as modified on-the-fly.
In case you wish to highlight certain occurences you can also create and edit comments which are shown at the exact position you select and can help in understanding certain issues later.

Widget: Trend Legend
As WebIQ trend widgets have been created as a kind of construction kit intentionally – so you can use and arrange them as you want in your HMI design – the Trend Legend widget shows the names, colors and units of items in an associated Trend Display widget. This is available in both horizontal and vertical layout and is of course fully responsive, so it adapts to different screen sizes automatically.

Widget: Trend Select
You can define defaults for which trend curves should be displayed in a Trend Display, but oftentimes you want the user to be able to choose different trend items for the display straight from the HMI. That’s what the Trend Select widget has been created for allowing the user to select any of the items recorded in the recorder and added to a trend in WebIQ Designer. Of course the user can also modify the colors of the trend straight from the HMI.

Widget: Trend Time
The WebIQ Trend system allows for displaying both live and historic data – as such the HMI user has to be able to select a start date and a duration for displaying the corresponding trend data. For this the Trend Time widget has been created:

Widget: Trend Zoom
With WebIQ’s fully responsive widgets the Trend Display is no exception – the user can zoom with the mouse wheel on the vertical axis, by keeping the SHIFT key pressed also on the horizontal axis and on a touch screen the fingers can be used to zoom in and out of a trend (“pinch to zoom”).
For ease of access a separate widget – that can be placed anywhere next to the Trend Display – can be used that allows for zooming in and out via a simple button click.

Widget: Trend Live
When displaying live trend data sometimes you want to have a closer look at some data that’s been recorded so you want to pause the live trend to inspect the data. For this the Trend Live widget has been created which allows you to do just that – and of course you can position it in any way you like.

Adaptability
As the widgets have all been designed straight from the start using responsive design they adapt automatically to the available space so you can also create small and different displays as an example:

But just see for yourself here in our online demo.
Why not just signup now for free? You’ll get access to the latest WebIQ version, a trial license and you can download WebIQ Designer immediately, download the Trend demo and test and modify it yourself?
Cover Image © Gorodenkoff @ depositphotos